Cloud Diagram Server Best Practices: A Comprehensive Guide
Cloud diagram server best practices are essential for effectively designing, communicating, and documenting cloud infrastructure. By adhering to these best practices, organizations can ensure that their cloud diagrams are clear, concise, and visually appealing, enabling stakeholders to understand and interpret cloud architecture with ease.
This guide provides a comprehensive overview of cloud diagram server best practices, covering topics such as choosing the right tools, creating effective diagrams, and using diagrams to communicate cloud architecture effectively.
Best Practices for Designing Cloud Diagrams
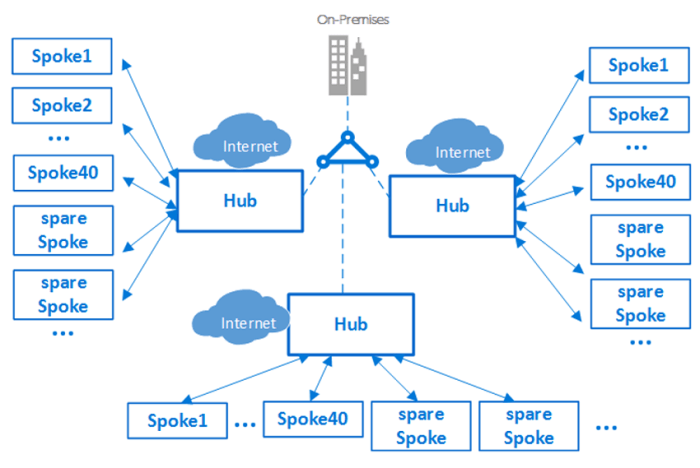
Designing clear and effective cloud diagrams is crucial for communicating complex cloud architectures. Consistency in symbols and notations ensures that diagrams are easily understood by all stakeholders. Best practices include using standard shapes and colors to represent different cloud components, such as circles for virtual machines and squares for databases.
Use of Color Coding and Labeling for Clarity
Color coding can help distinguish between different types of components, such as using green for compute resources and blue for storage. Labeling components with descriptive names provides additional context and makes the diagram more informative. Consider using a legend to explain the meaning of colors and labels.
Choosing the Right Cloud Diagram Tool
Choosing the right cloud diagram tool is essential for creating effective and informative diagrams. Different tools offer various features and capabilities, so it’s important to compare and contrast them before making a decision.
Key Features and Capabilities
When selecting a cloud diagram tool, consider the following features:
- Support for different cloud platforms and services
- Ability to create both logical and physical diagrams
- Collaboration features for multiple users to work on diagrams simultaneously
- Export options to various formats, such as PDF, PNG, and SVG
- User-friendly interface and ease of use
Recommendations for Specific Use Cases
Based on different use cases, here are some recommended cloud diagram tools:
- Visio:Suitable for creating detailed and complex diagrams, especially for large-scale enterprise environments.
- Lucidchart:A collaborative and user-friendly tool with a wide range of templates and shapes for cloud diagrams.
- draw.io:A free and open-source tool that supports multiple platforms and offers a wide variety of shapes and stencils.
- Cloudcraft:A cloud-native tool that provides automated cloud diagram generation based on real-time infrastructure data.
Creating Effective Server Diagrams: Cloud Diagram Server Best Practices
Server diagrams are essential for visualizing and understanding the architecture and relationships within a server environment. They provide a clear representation of the physical and logical components of a server system, making it easier to identify potential issues and plan for future growth.
Key Elements to Include, Cloud diagram server best practices
- Servers:Include all physical and virtual servers, identifying their roles and relationships.
- Network connections:Show how servers are connected to each other and to the outside world.
- Storage devices:Indicate the types and locations of storage devices, such as hard drives and solid-state drives.
- Operating systems:Identify the operating systems running on each server.
- Applications:List the applications hosted on each server.
Representing Different Server Types
Use different shapes and colors to represent different types of servers, such as:
- Physical servers:Rectangular shapes with labels indicating the server model and specifications.
- Virtual servers:Rounded rectangles with labels indicating the virtual machine name and guest operating system.
- Cloud servers:Cloud-shaped icons with labels indicating the cloud provider and instance type.
Organizing and Presenting Diagrams
- Logical grouping:Group servers based on their roles or functions, such as web servers, database servers, and application servers.
- Hierarchical layout:Arrange servers in a hierarchical structure, showing parent-child relationships.
- Color-coding:Use colors to differentiate between different server types or environments, such as production, staging, and development.
- Labeling:Clearly label all servers and components to enhance readability.
Documenting Cloud Infrastructure with Diagrams
Diagrams are a powerful tool for documenting cloud infrastructure. They can help visualize the architecture of a cloud environment, making it easier to understand and manage. Diagrams can also be used to track changes to a cloud environment over time.
Examples of Cloud Diagrams
There are many different types of cloud diagrams that can be used to represent different aspects of a cloud environment. Some common types of cloud diagrams include:
- Network diagrams: These diagrams show the physical and logical network connections between different components of a cloud environment.
- Server diagrams: These diagrams show the physical and logical relationships between servers in a cloud environment.
- Storage diagrams: These diagrams show the physical and logical relationships between storage devices in a cloud environment.
- Application diagrams: These diagrams show the relationships between different applications in a cloud environment.
Maintaining and Updating Cloud Diagrams
Cloud diagrams should be maintained and updated regularly to reflect changes to the cloud environment. This can be done manually or using automated tools. Automated tools can help to ensure that diagrams are always up-to-date and accurate.
Best practices for cloud diagram servers can help you keep your data safe. For more information on this topic, see our article on Cloud diagram server security . By following these best practices, you can help to ensure that your cloud diagram server is secure and your data is protected.
Using Diagrams to Communicate Cloud Architecture
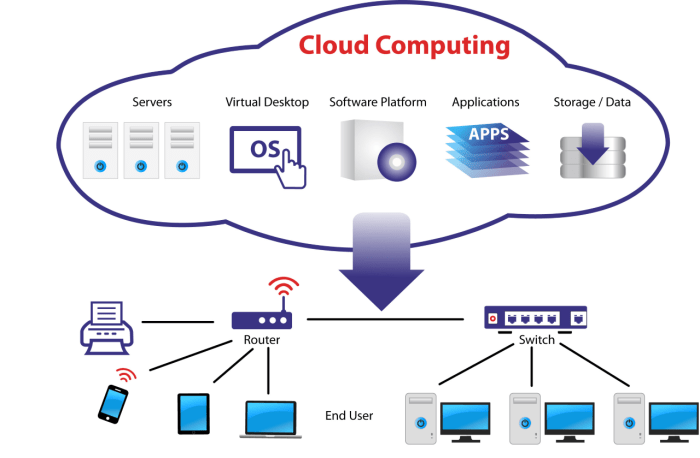
Diagrams are a powerful tool for communicating cloud architecture to both technical and non-technical audiences. They provide a visual representation of the system, making it easier to understand the relationships between different components and how they work together.
When creating diagrams for cloud architecture, it is important to keep the following tips in mind:
- Clarity:The diagram should be easy to understand, even for non-technical audiences. Avoid using jargon or technical terms that may not be familiar to everyone.
- Conciseness:The diagram should be as concise as possible, while still providing all of the necessary information. Avoid cluttering the diagram with unnecessary details.
- Visual appeal:The diagram should be visually appealing, using colors, shapes, and other design elements to make it easy to read and understand.
Interactive diagrams can be a great way to enhance communication. They allow users to zoom in and out, rotate, and explore the diagram in more detail. This can be especially helpful for complex diagrams that would be difficult to understand in a static format.
Closing Summary
In conclusion, cloud diagram server best practices are crucial for organizations looking to optimize their cloud infrastructure. By following the guidelines Artikeld in this guide, organizations can create and maintain cloud diagrams that are both informative and visually appealing, facilitating effective communication and collaboration among stakeholders.
